GW&K Global Perspectives — May 2022
How Cheap are Emerging Market Equities?
Highlights:
-
Emerging marketing (EM) equities significantly underperformed developed market (DM) equities over the past year, reflecting China's homemade bear market, Russia's war and rising interest rates
-
As a result, EM equities look reasonably valued on a number of measures relative to their own history and remarkably cheap compared to the S&P 500 Index.
-
Although EM equities continue to face near-term challenges, their potential for long-term outperformance has rarely been more compelling based on relative valuations.
A challenging period for EM equities
Numerous valuation measures demonstrate EM's remarkable valuation discount
A simple illustration of relative equity valuations can be seen in the price-to-sales ratios of the S&P 500 Index and the MSCI EM Index. Those ratios traded respectively at 2.6 and 1.3 times as of the end of April (Chart 1). In other words, by this very simple metric, EM equities are trading at half the valuation of U.S. equities.
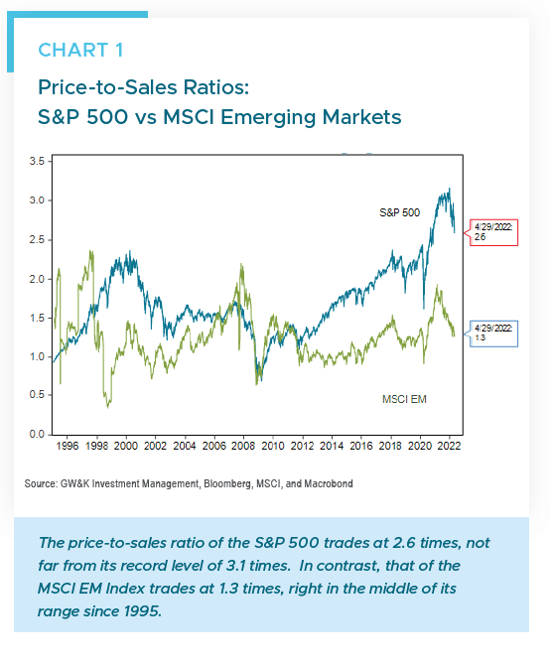
Note also that, relative to their own history, EM equities look fairly valued by this measure since they trade close to the middle of their price-to-sales valuation range since 1995 (60th percentile). In contrast, despite the relatively modest correction in U.S. equities so far this year, the S&P 500 Index continues to trade near the upper end of its historic price-to-sales valuation range since 1995 (95th percentile).
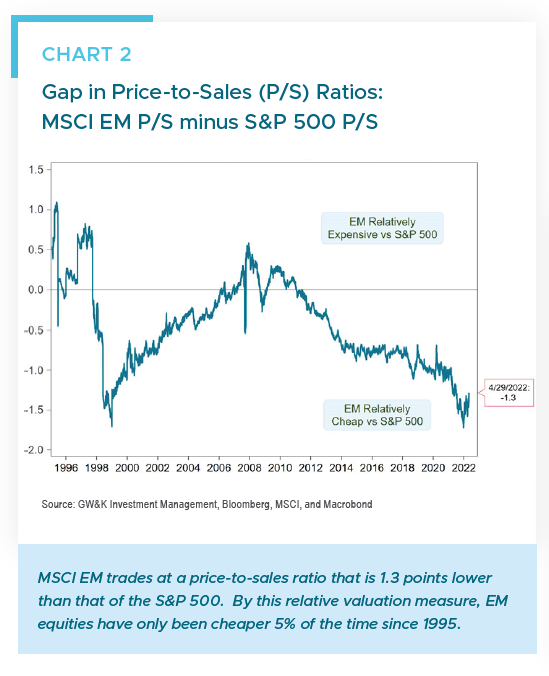
Now consider the historical trend in the relative valuation of EM versus S&P 500 equities, using the gap in price-to-sales ratios as a key measure. The current spread of -1.3 points (1.3 minus 2.6) puts EM’s relative valuation versus the S&P 500 near the very bottom of its historic range since 1995 (Chart 2). Indeed, on this simple valuation comparison, EM equities have only been relatively cheaper than the S&P 500 5% of the time since 1995.
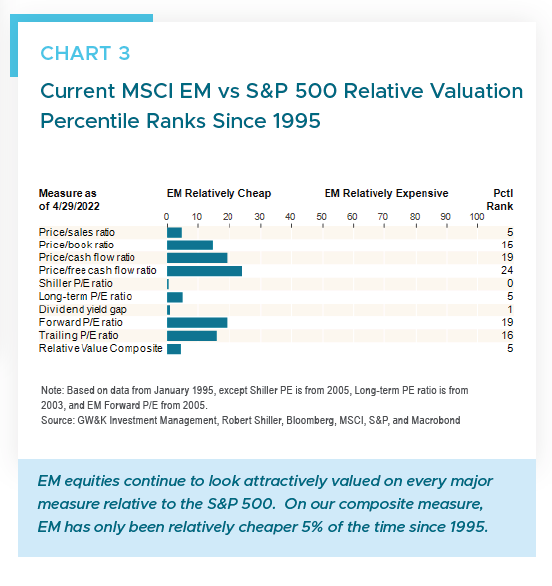
Using monthly data, we performed a similar analysis on a wide range of equity valuation measures going back to 1995 and got similar results. The measures we considered were:
- Price/book ratios
- Price/sales ratios
- Price/cash flow ratios
- Price/free cash flow ratios
- Shiller P/E ratios
- Long-term P/E ratios (CAPE 10)
- Dividend yield
- Forward P/E ratios
- Trailing P/E ratios
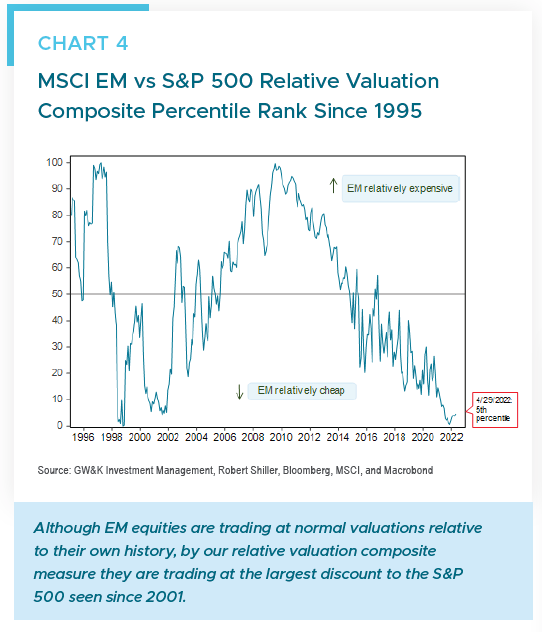
The results show clearly that on every measure, EM is trading toward the bottom end of the historic valuation range relative to the S&P 500 (Chart 3). Indeed, a compostive relative valuation -- one that equally weights all of those relative valuation measures -- shows that EM has only been cheaper versus the S&P 500 5% of the time since 1995 (Chart 4).
Such comparisons come with caveats. For example, the S&P 500 Index has a notably higher weight than the MSCI EM Index in Growth sectors like Information Technology (28% vs 22%) and Health Care (14% vs 4%). Such sectors tend to have higher profit margins that support higher equity valuations than those found in Value sectors like Energy and Financials. So differences in sector composition across time between the S&P 500 and the MSCI EM Index may distort index-level valuation comparisons to some extent. Differences in country weights may also affect the comparisons, since China’s weight in the MSCI EM Index has grown substantially over the past ten years from about 17% to 30%.
Relative valuations matter for long-term returns
Another important caveat is that valuation measures usually have close to zero correlation with short-term returns over one- or two-year periods. However, they tend to be more informative over longer-term periods of three to five years. That means they can be helpful to long-term investors and asset allocators, even if they offer little guidance to short-term traders.
Based on quarterly data since 1995, our composite measure of EM vs S&P 500 relative valuation does appear to have given useful signals. Consider the gap between five-year annualized returns for the MSCI EM Index versus the S&P 500 Index. Historically, when EM initially traded at a significant discount, the MSCI EM Index subsequently tended to outperform the S&P 500 by a wide margin over the next five years (Table 1). The opposite was the case when EM initially traded at a premium to the S&P 500.
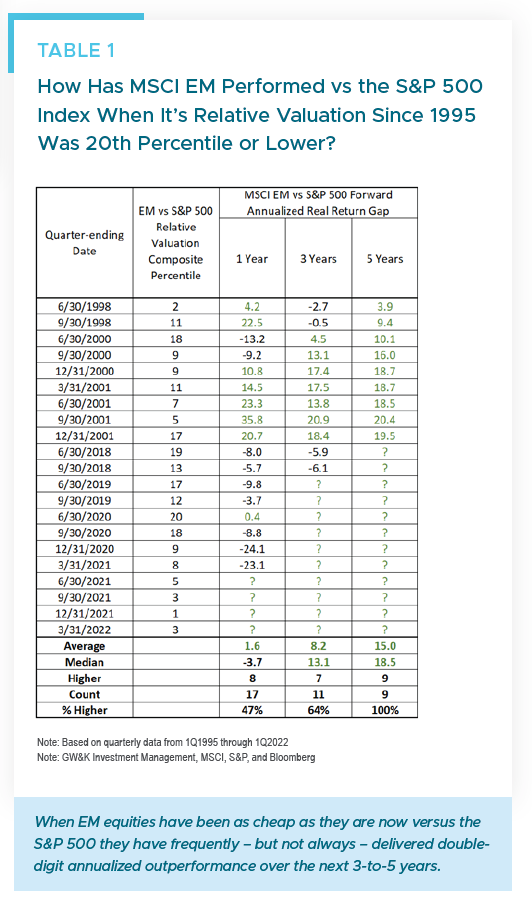
To be sure, there can be a wide range of outcomes associated with any starting level of relative valuation for EM vs the S&P 500. This is especially true on a 1-year ahead basis, where history shows only about a 50% hit rate for EM outperformance even when EM has been at a substantial valuation discount to the S&P 500. The key message from Table 1 is that there has historically been a definite skew toward long-term EM outperformance of the S&P 500 when EM’s starting discount is as pronounced as it is now. If history is any guide, the odds appear to favor EM outperformance versus the S&P 500 over the next five years.
Although EM economies face near-term challenges as central banks fight inflation pressures and China’s Covid lockdowns continue, it seems likely that EM economic growth will outperform U.S. growth on a three- to five-year view. Indeed, the recent World Economic Outlook by the International Monetary Fund projects trend growth rates in 2027 for the EM economies of 4.4% compared to only 1.6% for the DM Economies and 1.7% for the U.S.
In short, despite near-term headwinds, the potential for EM equities to deliver long-term outperformance versus U.S. equities has rarely been more compelling based on relative valuations.
Combined with prospects for a resumption of stronger EM growth in coming years, EM equities should continue to represent a useful complement to U.S. equity holdings.
William P. Sterling, Ph.D.
Global Strategist