GW&K Emerging Wealth Insights — January 2023
Considerable Upside Potential for China Equities Warrants Exposure
China equities have rallied considerably recently, rising by more than 50% from the lows in October 2022. Despite this rally, they are still down more than 50% from the peak in February 2021, materially underperforming all major economies in the MSCI World Index with an annual return of -4.5% for the past 5 years. By comparison, US equities had a positive annual return of 8.8% for the same period, according to the MSCI USA Index.
However, as China reverses the policies that have hindered its stock market over the past few years, the return potential over the next 5 years is quite extraordinary. The combination of strong economic growth, an improvement in margins, and a return to average valuation have set the stage for China to potentially move from near the bottom of the performance list to the top.
In this piece, we analyze 22 years of data, including historic profit margins and valuations for China. Our conclusion is that despite the concerns, China — the second largest global economy — is too big to ignore. Many multinational companies have come to the same conclusion. We believe investors will begin to recognize the return potential in the years ahead.
Is There Further Upside for Chinese Equities?
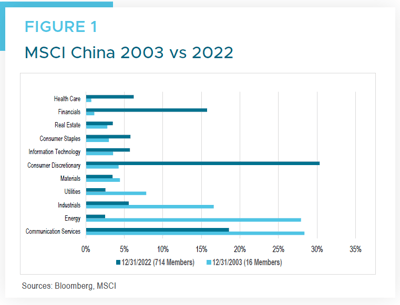
Although Chinese equities have returned more than 50% since the multi-year lows in October 2022, we believe there is scope for material additional upside from current levels. Before we go into the reasons for our bullish expectations, let’s take stock of the last 22 years of investing in Chinese equities, from January 2000 through December 2022:*
- Chinese equities have returned 5.5% per year in USD, including a gross dividend yield of 2.4%.
- Chinese EPS growth in USD was 3.5% per year during that period.
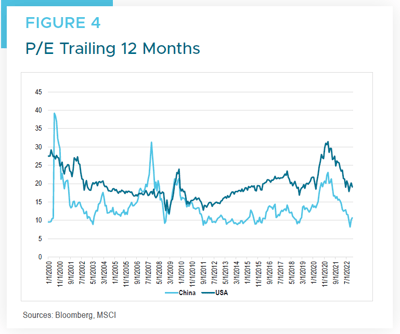
- Chinese 12-month trailing P/E was 11.7x on January 31, 2000, while it was 10.7x on December 31, 2022.
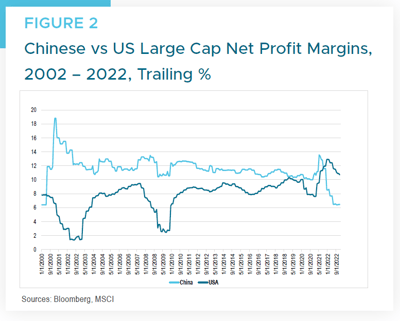
Our main argument supporting superior earnings growth for Chinese companies in the future compared to US large cap stocks is the fact that the recently ended zero-Covid policy had a dramatically negative impact on Chinese net profit margins:
- China’s net profit margin has averaged 11.5% between 2000 – 2022 (Figure 2), while the current net profit margin of 6.5% is close to its all time low. Pursuing a zero-Covid policy for the past couple of years has been taxing to corporate margins in China.
- US large cap net profit margins (7.8% average 2000 – 2022; Figure 2) have historically been lower than Chinese net profit margins (11.5%). However, due to the pandemic stimulus, US margins caught up to Chinese peak margins in 2021. Currently, US margins are under pressure from slower top-line growth and rising input-cost inflation. Deglobalization and onshoring of manufacturing could pose a threat to net margins for large cap US companies.
- The dramatic exit from the zero-Covid policy three months ago has set the stage for a strong recovery in Chinese net profit margins. Consequently, the IMF has raised its 2023 GDP forecast
for China from 4.6% to 5.4%. We believe this signals the reopening of the Chinese economy is in full force early in 2023.
What Caused Volatility in Chinese Profit Margins?
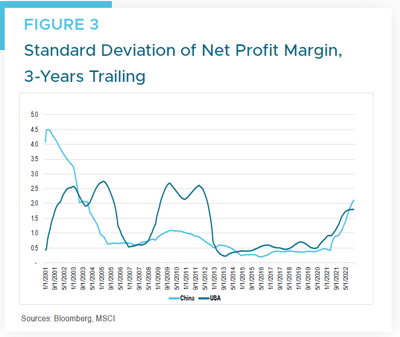
Chinese net profit margins experienced high levels of volatility early on in our 20-year research period partly because the benchmark included less than 20 members in total. As the number of Chinese companies included in MSCI China increased, volatility in net profit margins declined to more normal levels (Figure 3).
For the period 2001 – 2022, the volatility in Chinese net profit margins was lower (1.09) than in US large cap stocks (1.3). More recently, the zero-Covid policy increased the volatility in Chinese net profit margins, which are now higher than US large cap stocks.
Chinese Equities Could Return More Than 90%
Chinese equities would benefit materially — and provide significant upside for investors — if post zero-Covid profit margins returned to historical average levels. Returning net profit margins, currently at 6.5%, to the historical average of 11.5% while maintaining the current 11.7x P/E, would give investors a 79% investment return (Figure 3).
Historically, Chinese equities have traded at a 29% discount versus US large cap equities (Figure 4). That discount is currently 44%. Returning net profit margins to the historical average of 11.5%, and the discount of Chinese equities to US large cap equities to 29%, has the potential to give investors 99% investment return.
In essence, the combination of a recovery in net margins and an expansion in the P/E could offer investors returns above 90%. This does not factor in the potential for exceptional growth of the Chinese economy and lower volatility in corporate profit margins going forward.
What Are The Risks?
Anyone considering investing in Chinese equities should factor in the risks for the possible isolation of China driven by:
- Increasing trade tensions between the US and its allies towards China. One clear example is the current ban on exporting high-end computer chips to China by multiple Western nations, led by the US.
- Government intervention in the economy and the crowding out of the private sector.
- Potential conflict between China and Taiwan.
- Challenges in managing a self-inflicted bursting of the real-estate bubble.
We believe the growth in middle-class consumption centered in Asia will be the most powerful investment driver of returns over the coming decades. We believe China will attain rich nation status by 2035 as it continues to shift its economy to consumption and retain its currently unrivalled competitive edge in manufacturing. Finally, we believe that even with the risks mentioned above, investors should consider an allocation to Chinese equities in their portfolios. We believe well-run companies with strong brands and sustainable competitive advantages serving the EM consumer in Asia in general, and in China in particular, are likely to continue to experience strong earnings growth and equity returns. As of January 31, 2023, GW&K’s Emerging Wealth Strategy has a weight in China of approximately 59%, which compares with the China weight of 33% in the MSCI EM index.
