GW&K Global Perspectives — April 2023
Leverage Revisited: Assessing US Debt Amid Recession Fears
Highlights:
- Despite recession concerns, US households and businesses remain cash-rich, with high net worth and ample liquidity, contributing to the economy’s resilience.
- Such robust private-sector balance sheets should help the economy avoid a severe downturn and recover swiftly once the Fed lowers interest rates.
- Increased federal leverage boosted households and businesses but leaves the government to contend with a large debt burden and rising net interest expenses.
Debt Check
As concerns of a US recession persist due to aggressive Fed rate hikes and recent banking stress, a timely analysis of major trends in US domestic debt may be helpful for investors wondering if parallels can be found in today’s landscape and that of the Great Recession of 2007 – 2009.1
Fortunately, current vulnerabilities appear modest. Households and businesses remain cash-rich, and financial sector leverage has decreased considerably. However, the government’s extensive fiscal policy leaves it more leveraged and less flexible in addressing an economic downturn, setting the stage for a political showdown over the debt ceiling this summer.
A natural way to look at leverage is to compare a nation’s various debt measures to the size of its economy. Figure 1 presents America’s total domestic debt outstanding as a percentage of GDP.2 Following a "super spike” to 390% in the second quarter of 2020, the total debt ratio gradually fell back to 339% of GDP, below the global financial crisis peak of 370% and returning to its mid-2011 level.
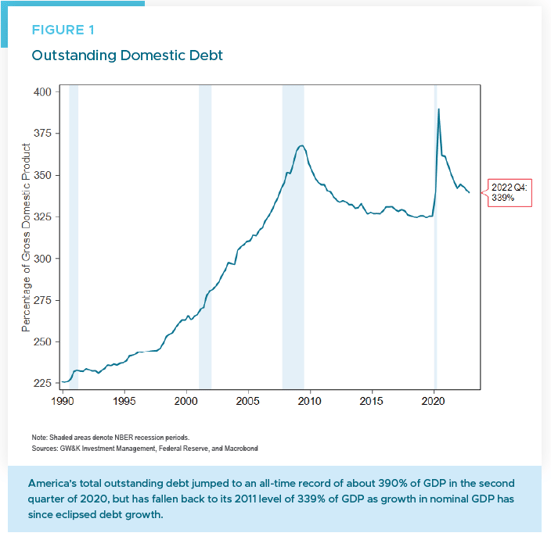
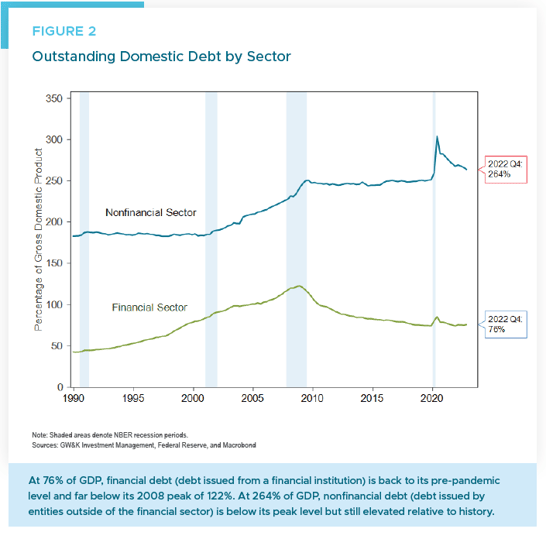
Figure 2 breaks down domestic debt into financial sector debt and nonfinancial sector debt, both as a percentage of GDP. The considerable spike in overall domestic debt was primarily driven by the nonfinancial sector, with the ratio falling to 264% of GDP at the end of 2022, remaining higher than any pre-pandemic level.
US Federal Leverage Boosted Households and Businesses
Figure 3 dissects nonfinancial sector debt into household, nonfinancial business, and government components, highlighting remarkable disparities. By the end of 2022, the household debt-to-GDP ratio reverted to its post-GFC deleveraging trend line, standing at 73% — the lowest since 2001.
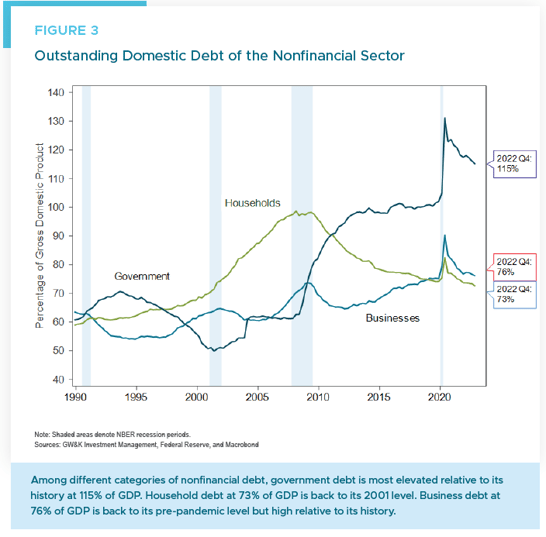
Nonfinancial business debt climbed from 74% of GDP in the fourth quarter of 2019 to 90% in the second quarter of 2020, reflecting the Fed’s liquidity facilities and fiscal policies like the Paycheck Protection Program (PPP). By the end of 2022, the ratio fell to 76% of GDP, only slightly above pre-pandemic levels. Meanwhile, government debt rose from 102% of GDP before the pandemic to 122% in the beginning of 2021, driven by the massive CARES Act and American Rescue Plan. By the end of 2022, it fell to 115% of GDP, still significantly above pre-pandemic levels.
These shifts in leverage patterns highlight sectoral balances, where federal sector deficits mirror private sector surpluses. The increase in government leverage improved private sector balance sheets. Unlike the pre-GFC era, the private sector’s relatively robust balance sheets should help the economy avoid a severe downturn and recover swiftly once the Fed lowers interest rates.
These findings emphasize the interconnectedness of economic sectors and the major role of government intervention during crises. While debt and leverage concerns are valid, it is essential to consider the broader context and underlying policy mechanisms that drive these shifts. This helps explain why the private sector continues to display resilience and stability.
Mortgages Dominate Household Debt; Student Loan Cliff Looms
Figure 4 breaks down household debt into mortgage and consumer debt. Mortgage debt, primarily driving fluctuations in household debt, peaked at 73% of GDP in 2009, fell to 48% by 2019, and returned to 48% by 2022, matching 2001 levels. Consumer debt remains modest at 18% of GDP, in line with 2001 levels.
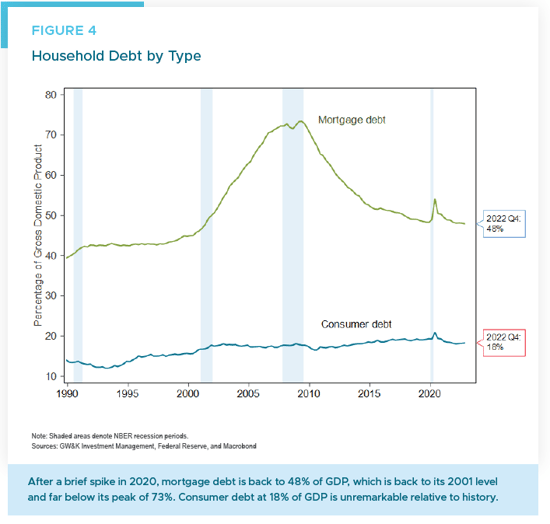
Figure 5 further categorizes consumer debt into credit card debt, auto loans, and student loans. Despite overall stability, student loans have surged from 3.5% of GDP in 2006 to 7.5% by 2019, crowding out other consumer debt categories. The rising costs of higher education sparked President Biden’s announcement to forgive up to $20,000 in student loans per borrower.
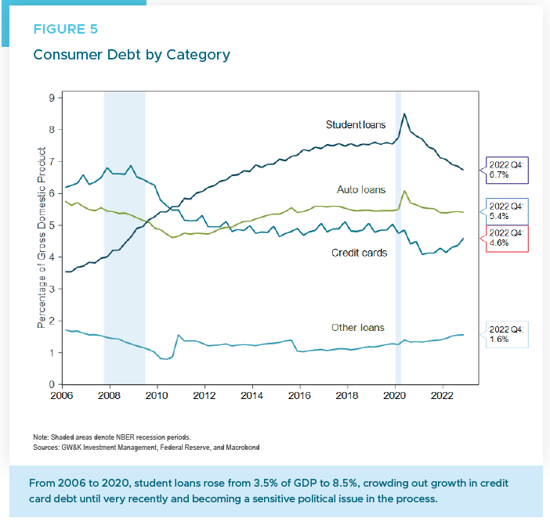
However, the legality of the student loan forgiveness program is now under scrutiny by the Supreme Court, and it appears increasingly unlikely that the payment moratorium will be extended. With loan payments set to resume in August, 45 million borrowers will face average monthly payments of around $400. This equates to a significant 0.6% reduction in personal income and has been dubbed the “Student Loan Cliff,” which could dampen consumer spending in the latter half of the year.3
Additionally, higher interest rates may constrain the growth of credit card debt and auto loans, as the Fed aims to curb demand by raising borrowing costs. And while overall consumer leverage looks modest, there are still likely to be areas of distress as the economy slows. For example, a recent article in the Washington Post noted that credit card debt is at an all-time high and nearly 25 million people are behind on their credit card, auto loan, or personal loan payments.4 This is the highest it has been since 2009 during the Great Recession. Many households are also behind on their utility bills. The situation could deteriorate if a recession arrives.
Cash-Rich Households and Businesses Weather Economic Headwinds
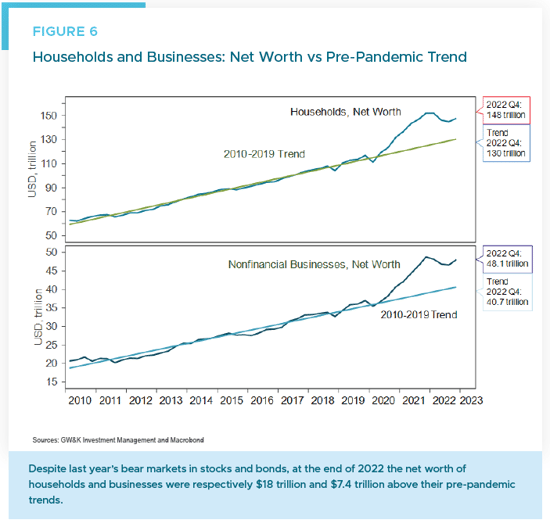
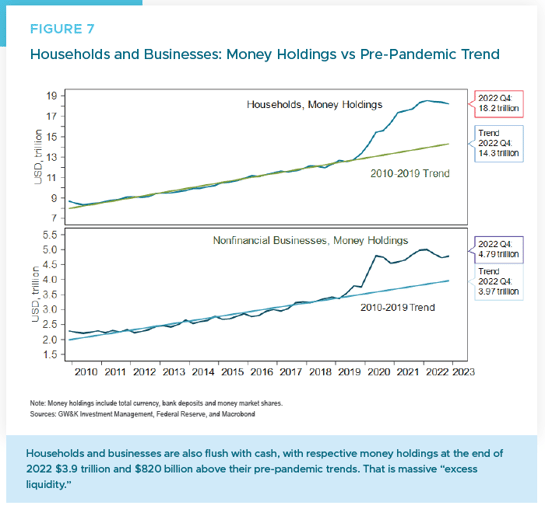
Focusing on net worth and liquidity levels, households and businesses appear well-equipped to handle economic challenges. Despite last year’s bear markets in stocks and bonds, both maintain high net worth and ample cash reserves.
Figure 6 reveals households’ net worth at $148 trillion and nonfinancial businesses’ at $48 trillion, both are significantly above pre-pandemic trends. Figure 7 displays money holdings, with households holding $18.2 trillion and nonfinancial businesses $4.8 trillion, equating to excess liquidity of $4.7 trillion or 18% of GDP.
In short, high net worth and liquidity levels contribute to the economy’s resilience amid aggressive Fed rate hikes. While not guaranteeing immunity, it helps explain the central bank’s determination to persist and avoid premature rate cuts.
America's Federal Debt Challenge: A Balancing Act
The improved financial conditions of households and businesses stem from the federal government’s pandemic-era policies, leaving a legacy of high inflation now countered by the Fed’s rate hikes. However, this increased federal debt and deficits raise concerns over a political clash on the debt ceiling.
A potential deadlock could result later this year in a partial government shutdown or a more severe risk of a debt default, which could increase recession odds and raise borrowing costs.5 The Congressional Budget Office (CBO) recently forecast a deteriorating fiscal outlook, with deficits over the next decade averaging $2.0 trillion annually.6 Net interest expense is forecasted to reach $1.4 trillion per year by 2033, constraining spending capacity (Figure 8).
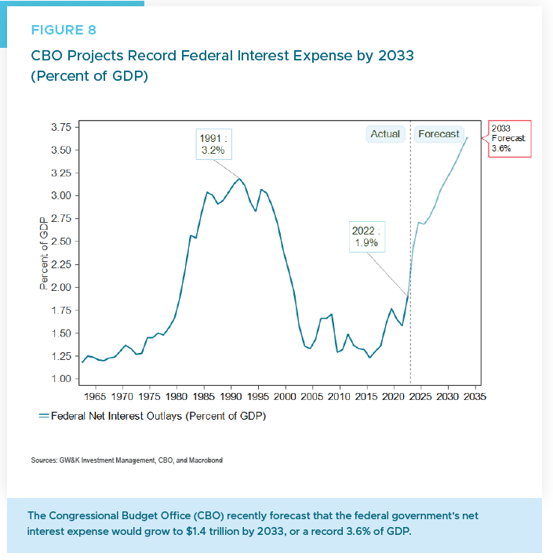
There is little doubt that Increased federal leverage boosted households and businesses during the pandemic. However, that now leaves the government to contend with a large and politically divisive debt burden and rising net interest expenses. How the nation’s leaders navigate this challenging situation is likely to be a high-stakes political balancing act for years to come.
For those fearing a reprise of the 2007 – 2009 global financial crisis, there is a silver lining: Household and financial sector leverage remain significantly lower than in the past. Higher interest rates may usher in slower growth, but today’s comparatively restrained leverage ratios mitigate potential risks for households and businesses alike.
William P. Sterling, Ph.D.
Global Strategist
1 For an analysis of how financial and household leverage contributed to the severity of the Great Recession see, for example, Mian, Atif; Rao, Kamalesh; and Sufi, Amir. “Household Balance Sheets, Consumption, and the Economic Slump,” Quarterly Journal of Economics, 2013, Vol. 128, Issue 4, pp. 1687-1726.
2 Our analysis builds on and updates that of Miguel Faria e Castro, “Domestic Debt Before and After the Pandemic Recession, On the Economy Blog, St. Louis Federal Reserve Bank, September 30, 2021.
3 See Thomas Simons, “The Coming Student Loan Cliff,” Weekly Economic & Bond Market Insight, Jeffries Financial Group, March 24, 2023.
4 Heather Long, “There’s a warning sign in this otherwise hot economy,” The Washington Post, March 8, 2023.
5 An analysis of the debt-ceiling issue can be found in Lucas Rengifo-Keller, “Breaching the debt ceiling is not the same as a government shutdown. Its consequences could be dire.”, Realtime Economics, Peterson Institute for International Economics, March 20, 2023.
6 See “The Budget and Economic Outlook: 2023 to 2033”, Congressional Budget Office (CBO), February 15, 2023.
