GW&K Global Perspectives — January 2023
There's Value in US Small Caps
Highlights:
- US small-cap stocks have significantly underperformed large-cap stocks over the last 5 – 10 years, after having delivered strong outperformance from 2002 through 2012.
- This performance pattern left US small caps cheaper than large caps by around 35% at the end of 2022 by one key measure, which could set the stage for jumbo returns going forward.
- Although small caps may be more vulnerable to a possible US recession than large caps, they have historically delivered strong outperformance during market recoveries.
US Small Caps Have Lagged Large Caps in Recent Years
US small-cap stocks have delivered disappointing performance over the last 5 – 10 years, but are now notably cheap relative to large caps. That creates the potential for a strong multi-year period of small-cap outperformance, notwithstanding the risk of further small-cap underperformance if a widely feared US recession develops over the coming year.
Small-cap stocks refer to companies with modest market capitalizations, measured by the sum value of outstanding shares. The Russell 2000 is the most widely followed index of small companies, with a median market cap of $950 million at the end of last year, rising as high as $8 billion. In contrast, the widely followed index of larger companies, the S&P 500 Index, had a median market cap of $29.4 billion, topping out at $2.1 trillion.
Even factoring in last year’s equity bear market, large caps have been on a tear versus small caps for many years (Figure 1).
- Over the past five years the S&P 500 rose at a 9.4% annual rate compared to only 4.1% for the Russell 2000.
- Over the past 10 years the S&P 500 rose at a 12.6% annual rate compared to only 9.0% for the Russell 2000.
- But over the past 20 years, the S&P 500 and the Russell 2000 rose at roughly comparable annual rates of 9.8% and 9.4%, respectively.
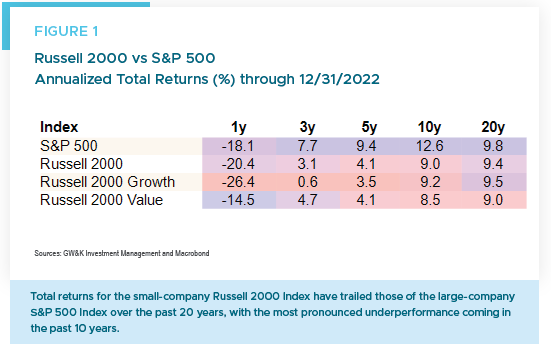
Although the 20-year underperformance of the Russell 2000 looks modest, at 0.4% per annum versus the S&P 500, it must still be considered disappointing. That’s because small-cap stocks tend to be riskier investments than large caps, yet investors have not been compensated for that risk with higher returns over two full decades.
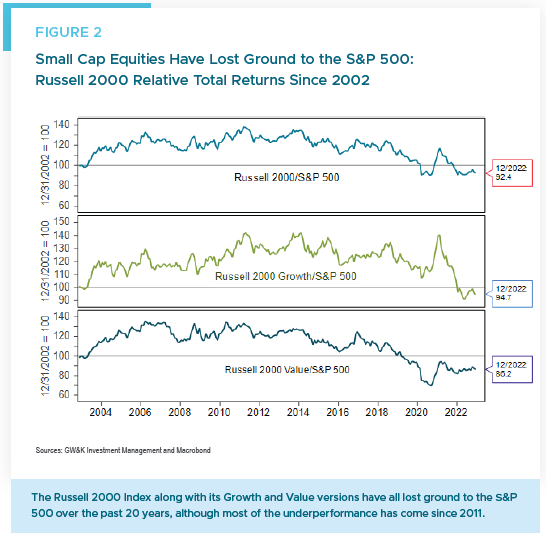
To be sure, the Russell 2000 did outperform the S&P 500 by a significant margin from 2002 through 2012, with annual gains of 9.7% versus 7.1%. However, the next decade’s poor showing by small caps more than offset small-cap outperformance from the previous decade (Figure 2).
Small Caps Have Delivered Strong (but volatile) Long-term Earnings Growth
Lackluster total returns of the Russell 2000 Index have not been due to notably poor long-term earnings growth (Figure 3). For example, over the past five years, the Russell 2000 Index has delivered annual Earnings per Share (EPS) growth of 11.7% versus 10.5% for the S&P 500 Index. And over the past 20 years, the Russell 2000 Index has delivered annual EPS growth of 9.0% versus 7.7% for the S&P 500.
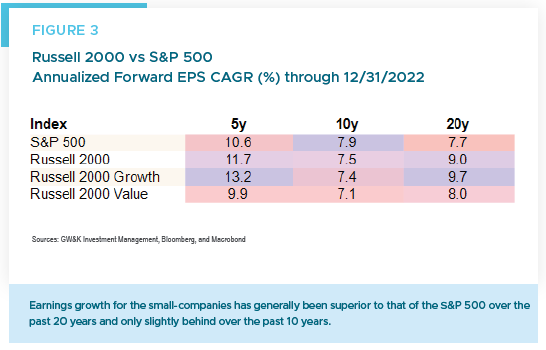
It is true that EPS growth for the Russell 2000 Index did lag that of the S&P 500 Index over the past 10 years. But that difference was relatively minor, with the Russell 2000 and S&P 500 posting respective annual EPS growth of 7.5% and 7.8%, respectively.
However, true to the risky reputation of small-cap companies, the volatility of EPS growth for the Russell 2000 has been far greater than that for the S&P 500 (Figure 4). As the chart shows, that was particularly true during stressful economic environments like the Covid downturn in the second quarter of 2020. During that quarter, EPS for the Russell 2000 companies fell by 88% from a year earlier, while EPS for the S&P 500 fell by 25% over the same period.
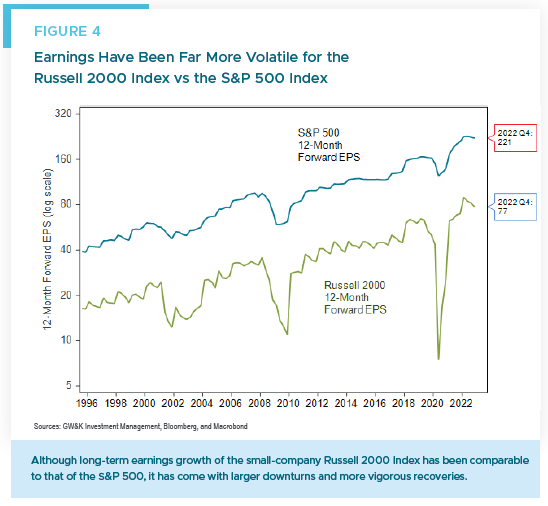
Likewise, the global financial crisis (GFC) saw a 54% decline in Russell 2000 EPS in the second quarter of 2009 from a year earlier compared to a 34% decline in S&P 500 EPS over the same period. Not surprisingly, the recoveries in small-cap earnings have been correspondingly more vigorous than those of large caps. Given the sharp EPS declines for small caps during stress events, robust earnings recoveries have been key to their superior long-term EPS growth.
Many Small Caps Are Now Extraordinarily Cheap
If poor long-term earnings growth does not explain the lackluster relative performance of small caps in recent years, the drag on performance must have come from declining stock valuations. Indeed, focusing on the last five years, the forward price-earnings ratio of the Russell 2000 Index fell to 22.7 at the end of last year from 34.4 at the end of 2017. That represents a multiple contraction of 34% over five years, which is equivalent to an -8% per annum drag on overall stock performance for that period.
In comparison, over the same period the forward price-earnings ratio of the S&P 500 fell from 20.0 to 17.4. That represents a multiple contraction of just 13%, or a -2.8% per annum drag on the corresponding performance of the S&P 500 Index over that period. The relatively modest multiple contraction of the S&P 500 effectively explains why the large-company S&P 500 has beaten the small-company Russell 2000 by five points a year over the past five years.
That said, with the Russell 2000 still trading at well above 20 times earnings, small caps can hardly be considered cheap by that measure. However, an important adjustment for small caps is to weed out the index’s unprofitable firms. On that basis, the index’s forward price-earnings ratio drops to 11.7 compared to a 20-year average of 17.5, or a comparably adjusted P/E ratio for the S&P 500 of 18.1 (Figure 5).
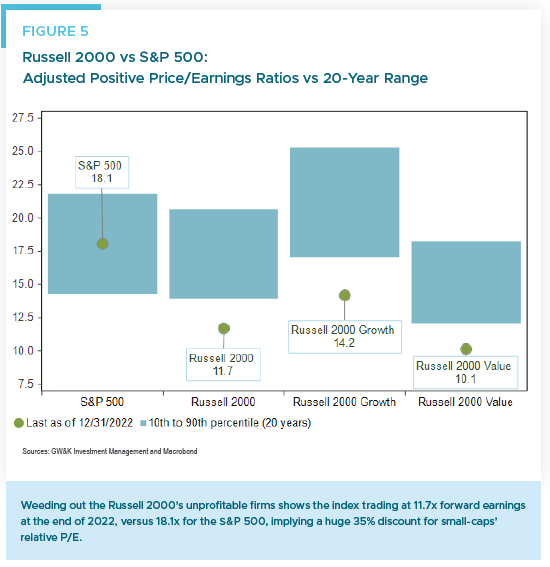
A key reason for the adjustment is that 33% of Russell 2000 members have negative earnings, compared to 20% a decade ago. That partly reflects the influx into the index of many early-stage, loss-making biotech companies. The biotech industry now makes up about 10% of the Russell 2000, up from 3% in 2012. That said, the higher ratio of unprofitable companies also reflects the disproportionate earnings hit many small firms took in the aftermath of the pandemic-induced recession.
On the adjusted measure, small caps are at a 35% valuation discount (11.7 vs 18.1) to large caps, which is an intriguing gap in valuations. That could set the stage for outsized returns for small caps going forward. According to recent research by Bank of America Securities, the adjusted P/E ratio for the Russell 2000 has been a better predictor of future returns than the unadjusted one.1 Based on data going back to 1985 and a standard statistical model, the Bank of America analysts predict 13% yearly returns for small caps over the next decade.2 That’s five points more than predicted for large caps, reflecting the huge difference in relative valuations.
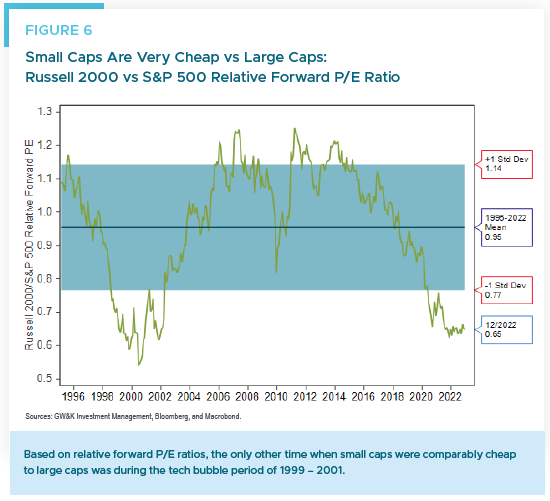
For some historical perspective, consider that the only other time small caps were comparably cheap to large caps was during the tech bubble period of 1999 – 2001 (Figure 6). Over the next seven years from March 1999 (trough in small- vs large-cap performance), small caps were up over 90% while large caps were flat. Over the full and challenging decade through March 2009, which marked the bottom of the global financial crisis, small caps rose by 6% while large caps declined by -38%.
Small Caps Tend to Outperform During Market Recoveries
The apparent deep discount of small-cap valuations may well be warranted if a recession delivers another outsized drop in earnings for small companies relative to large companies. Indeed, small-cap stocks already appear to be pricing in a deep recession. Note that the Russell 2000’s forward P/E ratio of 11.7 is trading at close to its lowest level in three decades. That puts it in line with lows during the global financial crisis and below the Covid recession and 2001 recession lows.
This may well be a case of extreme risk aversion, or a “once burned, twice shy” reaction of investors who experienced the sharp earnings declines in the two most recent recessions in 2007 – 2009 and 2020. But what if this turns out to be a mild recession, or a “soft landing?” It is worth noting that the New York Fed’s recession probability model, based on the US Treasury yield curve (10-year minus 3-month rates), is currently flagging 47% odds of a recession over the next 12 months (Figure 7).
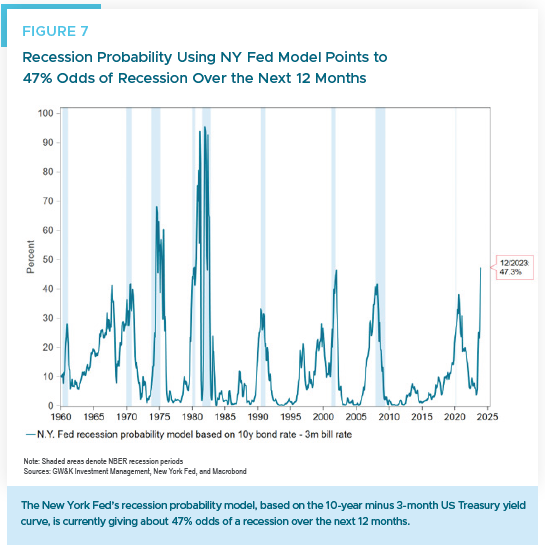
But that is also equivalent to saying there’s a 53% chance there will not be a recession. And it does not speak to the potential severity of the recession, which many economists believe could be mild thanks to relatively healthy consumer and business balance sheets. There is also the view that this is wholly a Fed-engineered recession, which can easily be reversed when the Fed decides that inflation is approaching its goal and eases monetary policy.
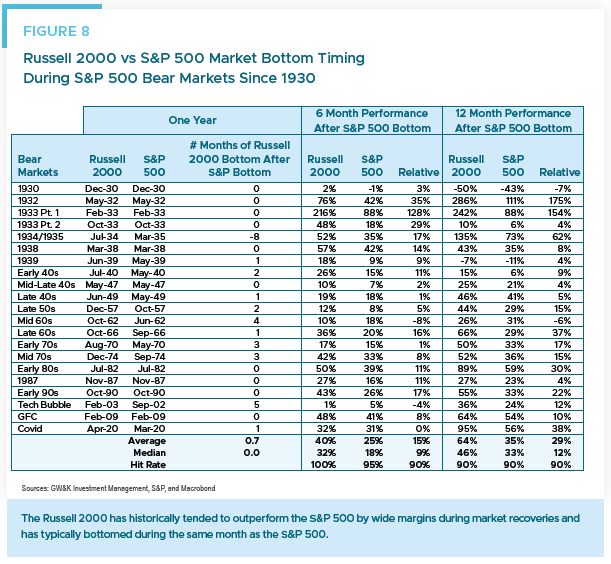
To be sure, small caps could still experience downside risk in coming months if a recession materializes and the market has another down leg. But it is worth keeping in mind that once the market bottoms, where small caps tend to bottom around the same time as large caps, that tends to be a time when small caps generate substantially higher returns than large caps.
Based on data since 1930 from Bank of America Securities, small caps have generated average returns of 40% compared to 25% for large caps in the six months following a bottom in the S&P 500 (Figure 8). Moreover, on a 12-month recovery horizon, small caps have generated 64% average returns versus 35% for large caps. The small-cap advantage has also been quite reliable, with small caps outperforming large caps in 90% of the market recoveries seen since 1930.
Conclusion: Small is Beautiful
Bear markets often bring changes of leadership in financial markets, which may be driven by valuation extremes reached by some sectors or asset classes or by changing growth dynamics in the economy. In the most recent quarter, we have already witnessed interesting and unexpectedly strong recoveries in non-US stocks, most notably in Europe and China.
We have yet to see convincing evidence of a shift in US stock leadership to small caps in relative price trends, although the challenges that mega-cap technology stocks have faced recently could be a fundamental factor that favors small caps. We have also seen speculation that small caps could be the beneficiaries of multi-year investment themes like reshoring and capex associated with the Inflation Reduction Act or the shift back to services spending after the pandemic surge in goods spending.
We will leave such speculative analysis for another day but conclude by re-emphasizing some facts we established earlier. First, small companies have been able to generate compelling earnings growth over long time periods, albeit with more volatility than their large-cap counterparts. Second, there are many small companies now trading at very attractive valuations. Finally, when markets recover small caps tend to generate substantially higher returns than large caps.
For all these reasons, small is beautiful — especially on a relative basis.
William P. Sterling, Ph.D.
Global Strategist
1 Jack Hough, “They Might Be Small, But the Payoff Looks Big,” Barron’s, December 2, 2022
2 Savita Subramanian, “Year Ahead 2023: Sprint lower, marathon higher,” Bank of America Securities, November 22, 2022