GW&K Global Perspectives — July 2024
Navigating the Concentrated US Stock Market
Highlights:
- US equity markets have recently experienced extremely narrow breadth, with a handful of stocks contributing to the lion's share of overall gains.
- Rather than seeing this as an ominous risk signal, we believe the market's "bad breadth" reflects a rational assessment of a tug of war between tight monetary policy and AI-driven exuberance.
- History suggests that investors are well advised to stick with broadly diversified portfolios rather than chasing returns in a handful of high-flying securities.
Understanding and Responding to US Market Concentration
In a year marked by artificial intelligence exuberance and stubborn inflation, the US stock market has defied expectations, posting robust gains amid economic uncertainty. However, a closer examination reveals a market driven by a handful of tech titans, leaving many investors questioning the sustainability and implications of this rally. This phenomenon, dubbed “bad breadth,” has reached extreme levels, prompting concerns about market health and future performance.1
The Magnificent Seven and Beyond
The term “market breadth” refers to the number of stocks participating in a market move. In 2024, breadth has been exceptionally narrow, with the so-called “Magnificent Seven” stocks — Alphabet,
Amazon, Apple, Meta, Microsoft, Nvidia, and Tesla — accounting for an outsized portion of market gains (Figure 1).2

The Magnificent Seven surged 37% in the first half of the year, but the broader market struggled to keep pace (Figure 2). The cap-weighted S&P 500 gained 15.3%, largely buoyed by these tech titans, while the S&P Equal Weight and small cap Russell 2000 Index eked out gains of just 5.1% and 1.7%, respectively.

This concentration isn’t limited to large caps. Even within the Russell 2000, a handful of names have driven the bulk of returns. The top five contributors more than accounted for the Index’s modest 1.7% first-half gain, masking weakness in the broader small-cap universe (Figure 3).

Decoding the Divide: AI Exuberance Meets Monetary Tightening
Rather than viewing this narrow breadth as an ominous portent, it’s crucial to understand it as a reflection of the current economic landscape. Two powerful forces are at play: the transformative potential of artificial intelligence and the constraining effect of tight monetary policy.
The earnings data tells a compelling story. Tech stocks, especially the largest names, have posted strong double-digit earnings gains (Figure 4). This contrasts sharply with the low single-digit growth seen in the S&P 500, excluding technology. Furthermore, earnings revisions have strongly favored the largest tech names, while the rest of the market has seen negative revisions (Figure 5).


This bifurcation in earnings performance helps explain the valuation gap evident in the data (Figure 6). The Magnificent Seven Index trades at a forward P/E of 32.7, almost double that of the S&P 500 Equal Weight Index at 17.6. While this premium may raise eyebrows, it reflects the market’s assessment of these companies’ growth prospects in an AI-driven future.

Historical Perspective and Future Implications
While the current market concentration is extreme, it’s not unprecedented. History shows that the ratio of the S&P 500 Equal Weight Index to the cap-weighted S&P 500 Index has fluctuated over time, with periods of both outperformance and underperformance for the average stock (Figure 7).
Note, however, that the long-term trend has been for the S&P 500 Equal Weight Index to outperform the cap-weighted index. Presumably that reflects the fact that a typical company, or smaller companies in general, have an easier time growing their earnings than the giants who already dominate their industries. Indeed, Warren Buffett has popularized the concept that size is the enemy of outperformance.3

That said, the magnitude of the current market divergence is striking. Viewed in year-on-year terms, the one-year performance gap between the S&P 500 Equal Weight Index and its cap-weighted counterpart has reached nearly 13%, a reading in the second percentile since 1990 (Figure 8). This level of concentration has historically been unsustainable.

Interestingly, periods of narrow breadth have often been followed by notable small-cap outperformance over subsequent 1-, 3-, and 5-year periods (Figure 9). This historical pattern may offer a glimmer of hope for patient investors in overlooked market segments.

The Case for Diversification
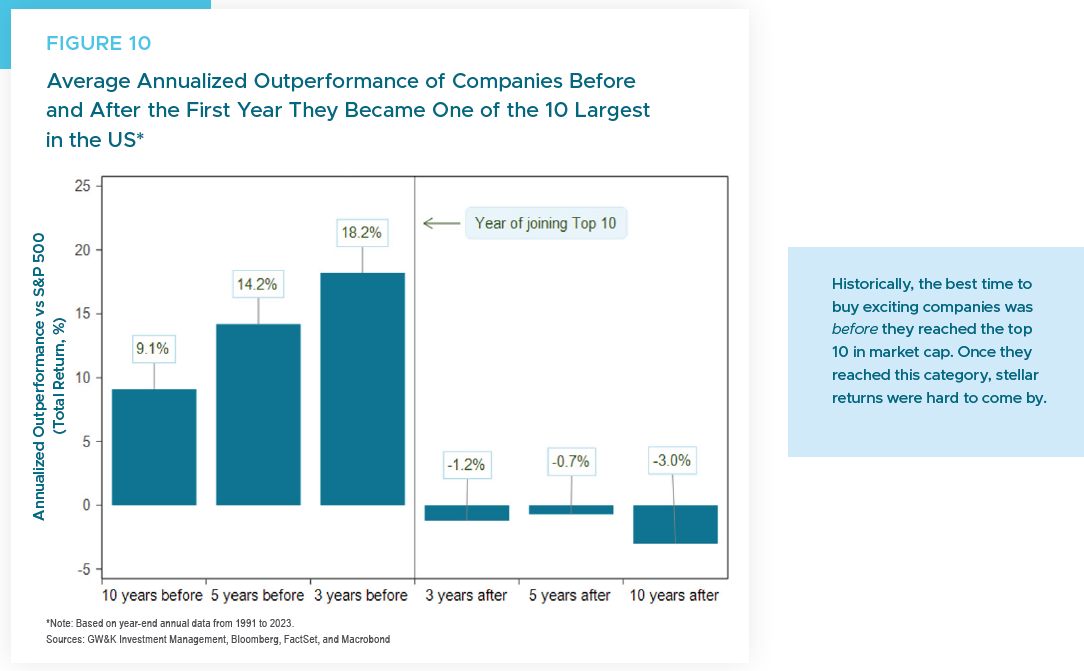
Given these dynamics, it might be tempting to concentrate portfolios in the handful of stocks driving market returns. But history offers a sobering reminder: the best time to buy exciting companies has historically been before they reached the top 10 in market cap (Figure 10). Once they achieved this status, stellar returns became much harder to sustain.
This insight, coupled with the cyclical nature of market leadership, makes a compelling case for maintaining broadly diversified portfolios. While it’s important to have exposure to potential AI beneficiaries, it’s equally crucial not to neglect other sectors and market segments that may be poised for a rebound.

Conclusion
The narrow breadth characterizing today’s market is neither an unambiguous buy signal for laggards nor a clear sell signal for leaders. Instead, it reflects a rational, if perhaps overzealous, response to a complex economic environment where technological disruption collides with monetary tightening.
For investors, the key is to resist the siren call of chasing returns in a handful of high-flying stocks. History suggests that market leadership is transient, and today’s laggards may well become tomorrow’s leaders. By maintaining a diversified portfolio, investors can position themselves to benefit from potential breadth expansion while managing the risks inherent in an increasingly concentrated market.
William P. Sterling, Ph.D.
Global Strategist
1 For example, economist Ed Yardeni recently noted that “Technical analysts are warning that this development increases the risks of a selloff in the market led by technology shares in general and semiconductor shares in particular — especially Nvidia.” See Ed Yardeni, “Market Call: Bad Breadth Again”, Yardeni Quick Takes, June 23, 2024.
2 Among the Magnificent Seven, Tesla’s performance has been a notable exception in 2024, with the stock having posted a -20.4% loss in the first half.
3 Warren Buffet, Letter to Berkshire Hathaway Shareholders (1996).
