GW&K Global Perspectives — September 2023
The Deficit Deluge: Understanding the Surge That Supported GDP and Stocks
Highlights:
- The larger-than-expected US federal budget deficit has provided a positive fiscal impulse, helping explain the economy’s resilience amid Fed tightening.
- Without the deficit surge, corporate profits and stock prices likely would have declined more sharply given other headwinds.
- A potential government shutdown could have a modest near-term impact, while eventual fiscal consolidation could begin to curb economic activity.
Another Explanation for the US Economy's Resilience
Despite the US Federal Reserve’s aggressive monetary tightening, the US economy has been surprisingly resilient in 2023. At the end of last year, most economists anticipated near-zero growth in real GDP this year. In contrast, Bloomberg’s survey of economists now projects that the economy will grow by 2.0% this year, reflecting steady upward revisions to the outlook. Moreover, the Atlanta Fed’s closely watched “nowcast” tool estimates that growth in the third quarter has accelerated to an annual rate of 4.9%.
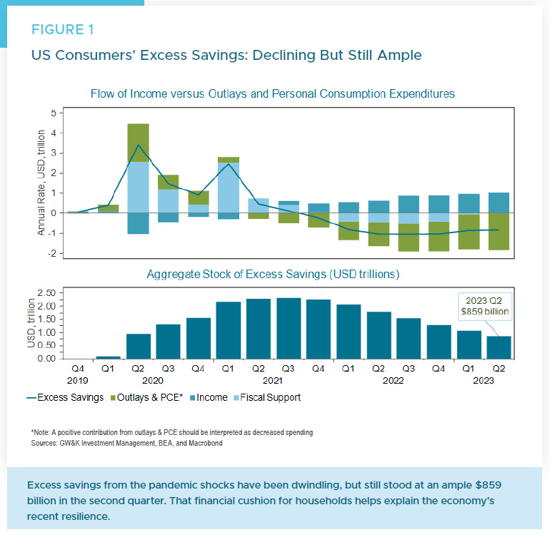
There are several competing explanations for the economy’s resilience, including a recent estimate by economic intelligence provider Macrobond, that there was still $859 billion of “excess savings” held by households as of mid-2023 (Figure 1).1 Those savings represent a legacy of pandemic fiscal transfers combined with initial spending caution by households. Although excess savings have dwindled from a peak of $2.6 trillion in mid-2021, the current $859 billion cushion still provides households with significant financial resources to spend despite the Fed’s rate hikes.2
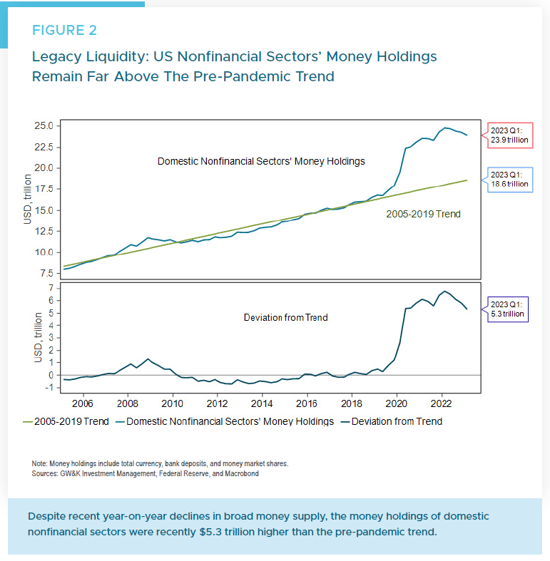
A related argument for the economy’s resilience is the amount of “legacy liquidity” among households following the extraordinary surge in the money supply during the pandemic.3 Even though year-on-year growth in the overall money supply has turned negative, its absolute level remains extraordinarily high. Using the Fed’s flow of funds data through the first quarter of this year, the money holdings of domestic nonfinancial sectors stood at $23.9 trillion (Figure 2). That was $5.3 trillion more than what the pre-pandemic (2005 – 2019) trend in money holdings would have implied, suggesting enormous cash reserves of close to 20% of GDP that could support spending.
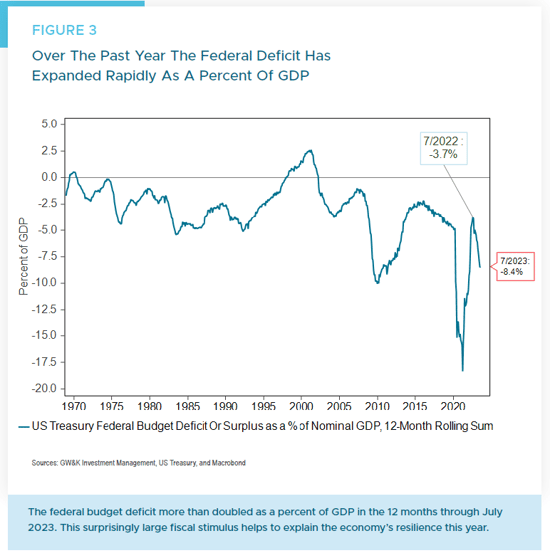
To those arguments, we can add another notable factor: the surprisingly massive surge in the US federal budget deficit to $2.26 trillion in the year through July, up from $962 billion the previous year. At face value, that means the deficit grew from 3.7% of GDP as of mid-2022 to 8.4% of GDP by mid-2023 (Figure 3). That represents a positive fiscal impulse of roughly 5% of GDP (the year-on-year differences in the two percentage figures). Moreover, this was apparently not anticipated in year-ahead forecasts, with Bloomberg’s December 2022 consensus survey pegging the deficit at about 4.5% of GDP in both years.4
Examining the Positive Fiscal Impulse
What do we mean by a positive fiscal impulse? The fiscal impulse is essentially the change in the budget balance, either from surplus to deficit or to a larger deficit, and vice versa. It is often used to measure the economic impact of fiscal policy. When governments increase spending or reduce taxes without corresponding revenue increases, it results in fiscal stimulus or a positive fiscal impulse.
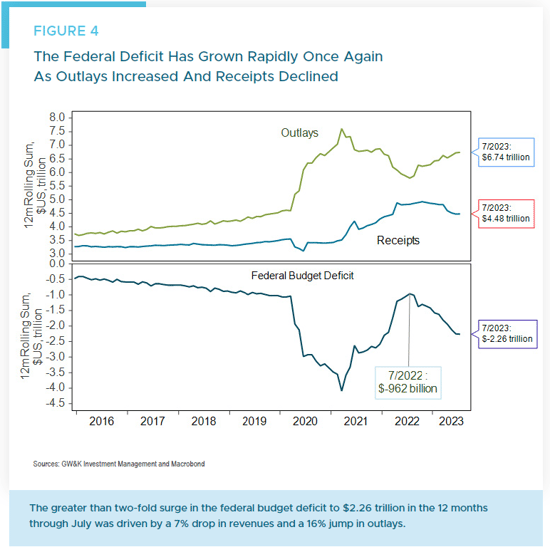
How did such a large fiscal impulse come about? At the highest level, it resulted from a 7% drop in federal revenues and a 16% rise in outlays over the 12 months to July 2023 (Figure 4). That meant the government was spending significantly more than it was taking in, injecting extra money into the economy. Such a surge in spending relative to revenues helps stimulate economic activity, even when it occurs due to automatic budget developments rather than new legislation.
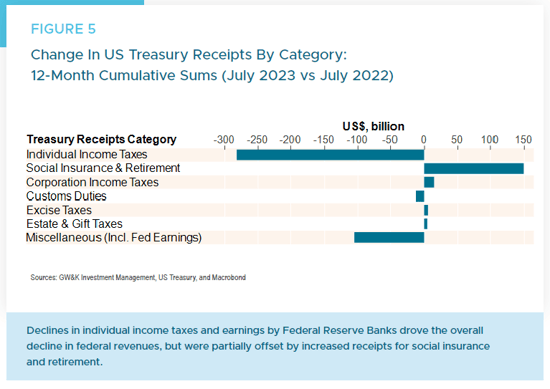
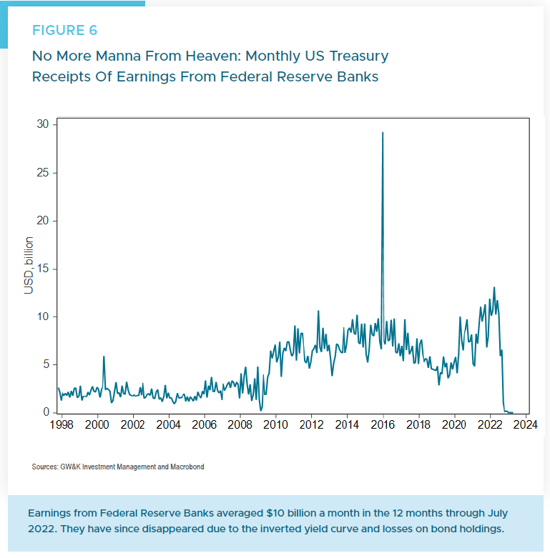
When examining the budget details, a few factors stand out in the revenue decline and spending increase (Figure 5). On the revenue side, income tax receipts fell by $280 billion, largely reflecting the 2022 bear market’s impact on capital gains and losses. In addition, a $105 billion decline in “Miscellaneous” revenues resulted from reduced Federal Reserve bank earnings given the inverted yield curve (Figure 6).
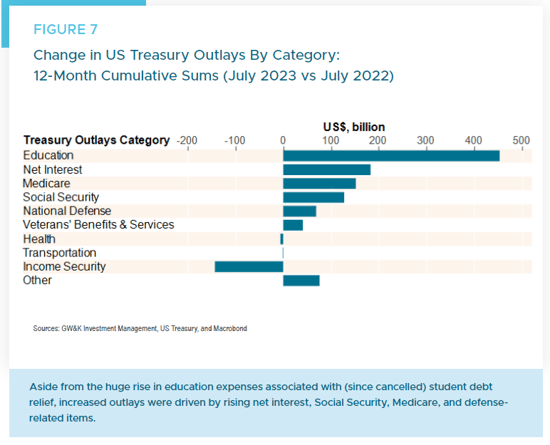
On the outlays side, the largest increase was $450 billion for education, reflecting the proposed (but blocked) student loan forgiveness policy (Figure 7). Aside from education, notable increases occurred in interest payments, Medicare, Social Security, defense, and veterans’ benefits. Many categories rose with inflation, though Social Security is formally indexed to CPI.
It should also be noted that the deficit increase was not due to new fiscal legislation, as was the case with pandemic relief in 2020 and 2021. To be sure, the Biden administration did pass significant bills last year, like the CHIPS and Science Act and the Inflation Reduction Act of 2022. But both bills combined add less than $10 billion to the deficit over the 2022 – 2023 fiscal years — a mere fraction in comparison to the recent deficit expansion.5
Additionally, the Supreme Court stopped the student debt relief plan in June 2023, meaning the reported deficit figures through July are overstated by about $320 billion.6 Adjusting for this overestimate, the actual deficit reached $1.93 trillion or 7.2% of GDP as of July 2023. That suggests a fiscal impulse of about 3.5% of GDP, which is still substantial and exceeds expectations. In our view, that surprising degree of fiscal stimulus does much to explain why estimates for real US GDP growth this year have been revised up from around zero to 2%.
Bigger Deficit, Stronger Corporate Profits
We would also argue the rise in the fiscal deficit meant US corporate profits fell by much less than they otherwise would have. This assertion is based on a national income accounting identity relating profits to factors including investment, consumption, and government spending.7It shows, all else equal, that increased government deficits boost corporate profits.
The intuition is that when government spending rises without corresponding tax hikes, the money injected into the economy ends up as corporate revenue, either directly (contracts) or indirectly (consumer/business spending from transfers or tax cuts). This can bolster earnings.
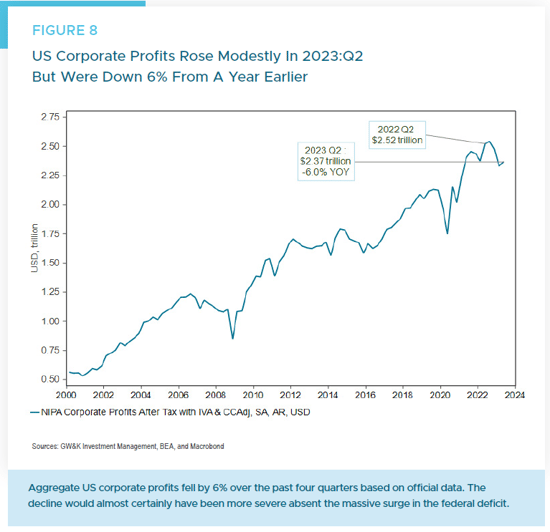
Using the latest data, aggregate corporate profits fell $155 billion in the second quarter of 2022, a modest 6% decline (Figure 8). But over that period, the overall government deficit surged by $1,058 billion.8 Other things equal, the increase should have boosted profits by that amount given headwinds like higher savings, lower investment, and reduced dividends (Figure 9).
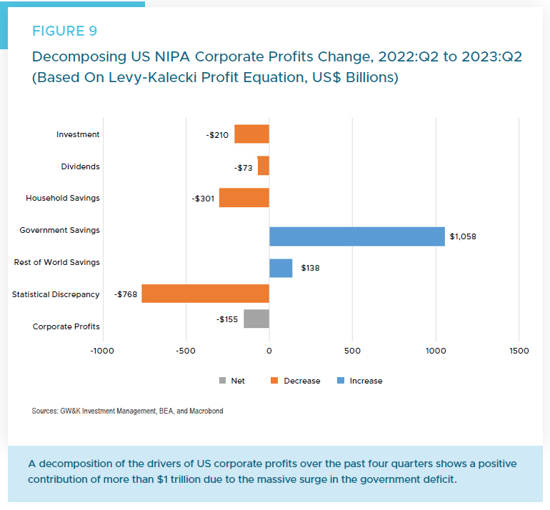
In short, without the expanding government deficit, US corporate profits likely would have seen a more pronounced decline. Ironically, the growing deficit has been an unsung hero supporting both corporate America and the stock market amid aggressive Fed tightening. That said, because it did not result from new legislation, the expanding deficit can be viewed as an “echo boom” — triggered by higher interest rates and high inflation, but against the backdrop of the massive deficit spending increase of 2020 – 2021.
The Future of the Deficit: What's Next?
Fiscal policy often raises the question, “What have you done for me lately?” Its positive effects on growth can rapidly shift to negative if an abrupt deficit expansion leads to political calls for fiscal consolidation. Such political maneuvering is expected to be evident in Washington, DC soon, with just 12 legislative sessions following the Labor Day holiday before the government funding expires at September’s end.
If Congress doesn’t approve the spending bills on time, here are some possibilities9:
- A “continuing resolution” is on the table, which is a bit like hitting the snooze button on your alarm. It means we’re deferring decisions.
- Then there’s the more drastic option — a complete government shutdown.
- We might see a mix of the two.
- If all else fails, there’s a backup in the Fiscal Responsibility Act: a 1% cut in discretionary spending starting January.
Historically, the economic consequences of government shutdowns appear controllable. There have only been four shutdowns in the past three decades. Goldman Sachs’ analysis of past shutdowns (with an average duration of 14 days) suggests a direct decline in economic growth by roughly 0.15 percentage points each week. Indirect effects increase this number to about 0.20 points.11 But the subsequent quarter often sees a rebound in growth as federal operations normalize.
From a historical viewpoint, financial markets haven’t had drastic reactions to past shutdowns. As observed by Goldman Sachs, equity markets usually remained stable or increased after the three extended shutdowns (1995 – 1996, 2013, and 2018 – 2019). However, equity prices often dipped in the days immediately following a shutdown’s inception. Notably, the 10-year Treasury yield generally declined during prior shutdowns, with the exception of the 2013 episode.
What might be more significant than the immediate repercussions of a potential government shutdown is its implications for long-term fiscal consolidation. If Washington simply returns to business as usual, we might see deficits nearing 6% of GDP going forward. This could lead to a slightly negative fiscal impulse in the subsequent year.
The 2024 election outcomes will likely play a pivotal role, shaping the fate of recent spending initiatives like the CHIPS or Inflation Reduction Acts. This election will also likely decide if the income tax and estate tax reductions introduced in 2017 — costing an estimated $300 billion annually — will persist post-2025. One very practical consideration for investors: those with sizable assets may wish to make significant gifts before the current estate and gift tax exclusion amounts potentially drop in 2026.
One thing is certain: fiscal policy will continue to be a primary concern for investors. With the potential for the government’s increasing interest payments to overshadow other budget priorities, there’s a lot of ongoing ambiguity about Washington’s fiscal trajectory. Even more uncertain is how politicians will react to these challenges.
William P. Sterling, Ph.D.
Global Strategist
1 Andrew Lieugart, et.al, “Capital cities, British purchasing power and dwindling US savings,” Macrobond blog, August 18, 2023.
2 Other estimates of US excess savings are lower. See, for example, Hamza Abdelrahman and Luiz Olivera, “The Rise and Fall of Pandemic Excess Savings,” FRBSF Economic Letter, May 8, 2023.
3 For more details, see William Sterling, “Leverage Revisited: Assessing US Debt Amid Recession Fears,” GW&K Global Perspectives, April 2023.
4 Survey Report: US Economic Forecasts in December 2022, Bloomberg News, December 20, 2022.
5 See Congressional Budget Cost Estimates for CHIPS and Science Act (H.R. 4346) and Inflation Reduction Act (H.R. 5376).
6 For more details see Congressional Budget Office, Monthly Budget Reports: July and August 2023.
7 This identity is known as the Levy-Kalecki profits equation. It defines corporate profits as follows:Corporate profits = Investment + Dividends/buybacks - Household savings - Government savings - Rest of world (ROW) savingsAs with other NIPA identities, the components add up exactly to the overall level of corporate profits once a “statistical discrepancy” term is added to the mix (as computed by the Bureau of Economic Analysis). For an excellent derivation and explanation see David A. Levy, et.al., “Where Profits Come From: Answering the Critical Question That Few Ever Ask”, The Jerome Levy Forecasting Center, 2008.
8 This figure is based on the National and Income Product Account (NIPA) figure for the overall government sector, including federal, state, and local government. It differs slightly from the US Treasury federal budget deficit figures quoted earlier, and was driven by — and closely matches — the change in the federal budget deficit.
9 See Ariana Salvatore, et. al, “Shutdown: The Other Fiscal Risk,” US Public Policy Brief, Morgan Stanley Research, August 10, 2023.
10 See Leigh Ann Caldwell and Theodoric Meyer, “Chance of a government shutdown grows,” Washington Post, August 22, 2023.
11 See Alec Phillips, “When the Government Shuts Down,” US Economics Analyst, Goldman Sachs Economic Research, August 20, 2023.
